Subplots
Subplots
- In this tutorial, we will explore how to use subplots for displaying multiple plots.
- Instead of using the same set of x and y-axis, If we want to display two lines side by side. Each set of axis in a single image that has several axes is referred to as a subplot.
-
We can create subplots using .subplot() and the command plt.subplot() needs three arguments to passed. The number of rows of subplots, The number of columns of subplots, and The index of the subplot we want to create.
-
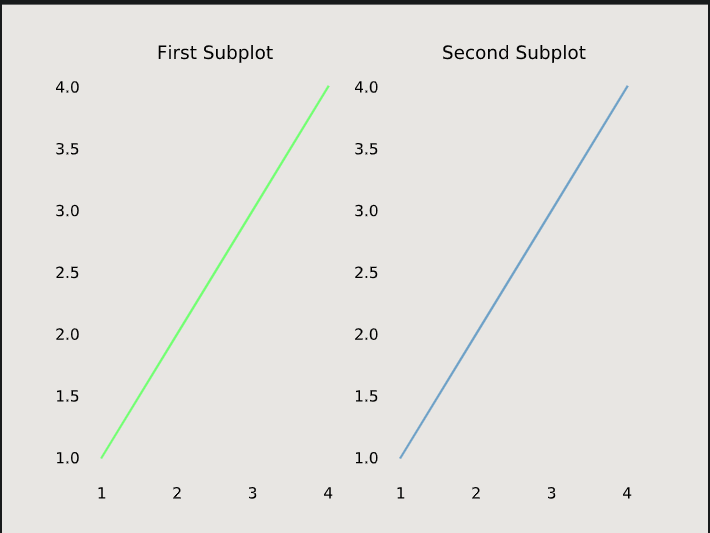
For Instance: from matplotlib import pyplot as plt # Data sets x = [1, 2, 3, 4] y = [1, 2, 3, 4] # First Subplot plt.subplot(1, 2, 1) plt.plot(x, y, color='green') plt.title('First Subplot') # Second Subplot plt.subplot(1, 2, 2) plt.plot(x, y, color='steelblue') plt.title('Second Subplot') # Display both subplots plt.show() -
This would result into:
Super Title
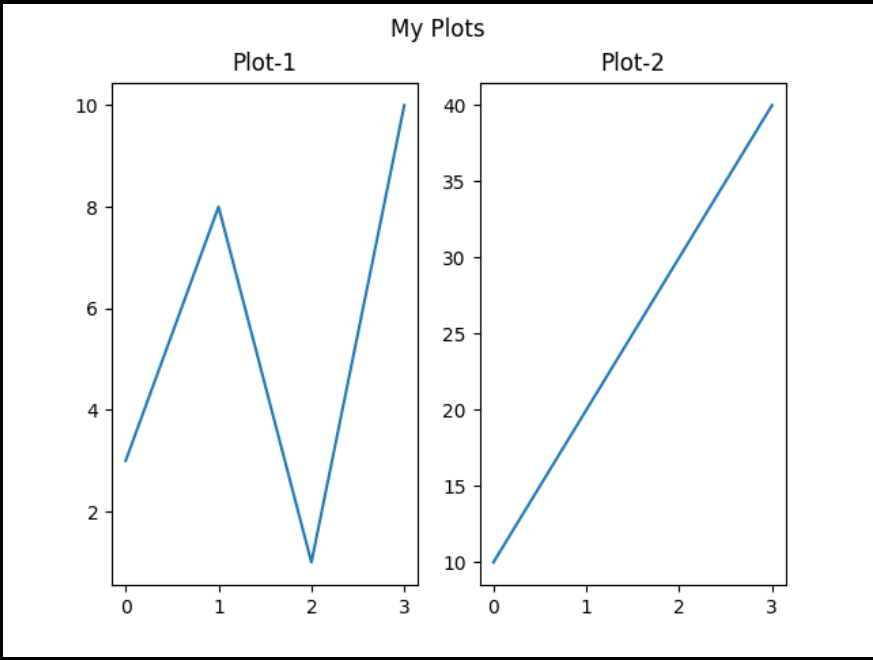
- We can also add the super title at the top of our subplots.
import matplotlib.pyplot as plt

#plot 1:
x = [0, 1, 2, 3]
y = [3, 8, 1, 10]

plt.subplot(1, 2, 1)
plt.plot(x,y)
plt.title("Plot-1")

#plot 2:
x = [0, 1, 2, 3]
y = [10, 20, 30, 40]

plt.subplot(1, 2, 2)
plt.plot(x,y)
plt.title("Plot-2")

plt.suptitle('My Plots')
plt.show()