Line-Plot
Plotting without line
- In the previous section, we learn how to plot a line graph using pyplot alias plt.
- Now, we are going to see how to plot without the line or more specifically with different notations like 'o' for rings.
- Let's have a look at this code demonstration.
from matplotlib import pyplot as plt

time = [0, 1, 2, 3, 4]
revenue = [200, 400, 650, 800, 850]

plt.plot(time, revenue, 'o')
plt.show()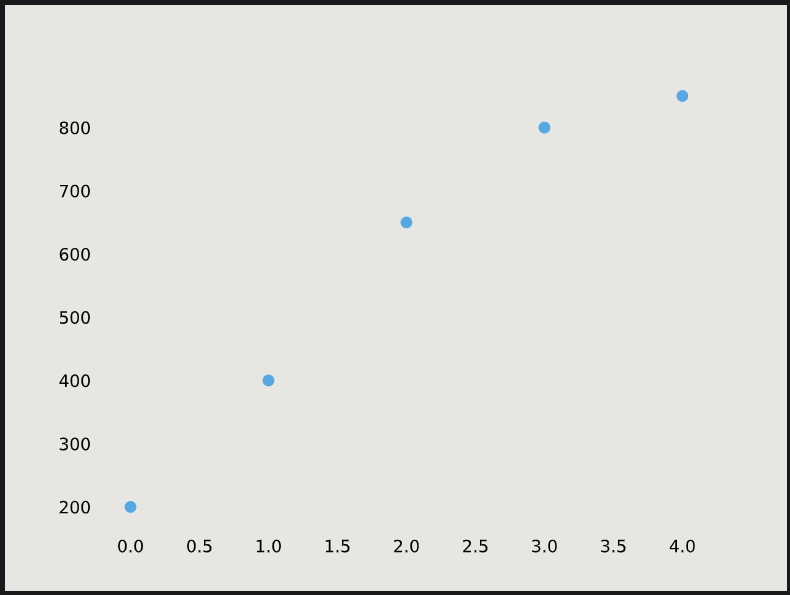
Default X-Points
- While plotting, if we do not specify the x-axis then they will get the default values 0, 1, 2, 3, 4, 5, etc.
- Let's plot a line graph using only y-points:
from matplotlib import pyplot as plt

y-points = [3,5,9,2,1,6,7,8]
plt.plot(y-points)
plt.show()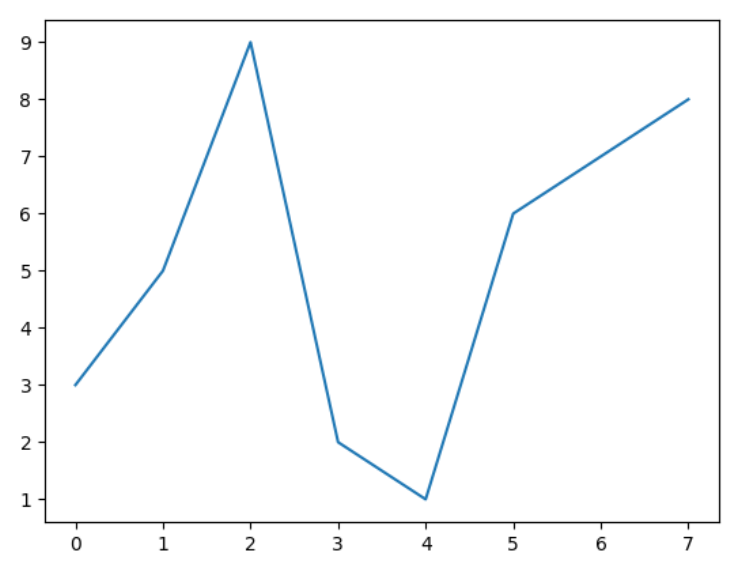
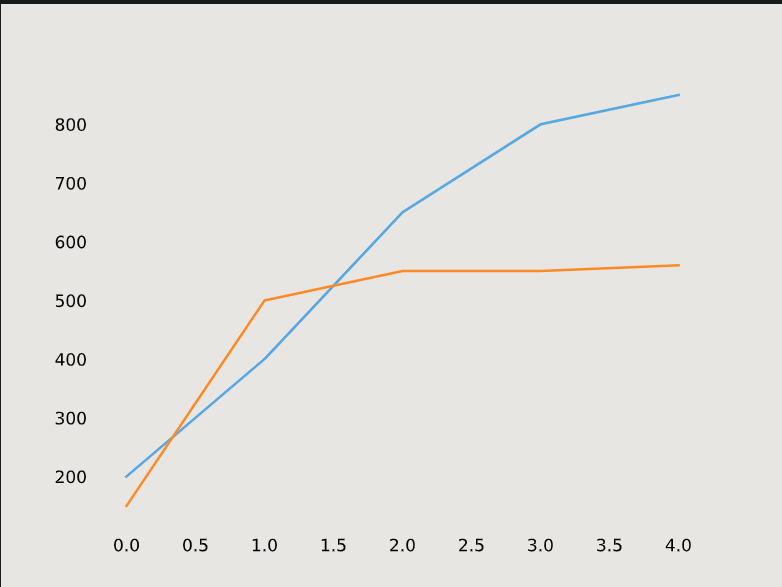
Multiple Line plots
- We can plot multiple line plots in the same graph.
- Matplotlib will automatically place the two lines on the same axes and give them different colors if you call
plt.plot()twice.from matplotlib import pyplot as plt lst1 = [0, 1, 2, 3, 4] lst2 = [200, 400, 650, 800, 850] lst3 = [150, 500, 550, 550, 560] plt.plot(lst1, lst2) plt.plot(lst1, lst3) plt.show()