Axis and Labels
Labels for Plot
- In this tutorial, we are going to learn how to label you plot along with we'll see how to zoom in or out in our plot with the understanding of axis.
- In pyplot, we can use xlabe() and ylabel() to set a label for x-axis and y-axis.
- The plot title can be set by using
plt.title(). - For Example:
from matplotlib import pyplot as plt

x = range(12)
y = [3000, 3005, 3010, 2900, 2950, 3050, 3000, 3100, 2980, 2980, 2920, 3010]
plt.plot(x, y)
plt.xlabel('Time')
plt.ylabel('Money spent on coffee')
plt.title('My Last Twelve Years of Coffee Drinking')

plt.show()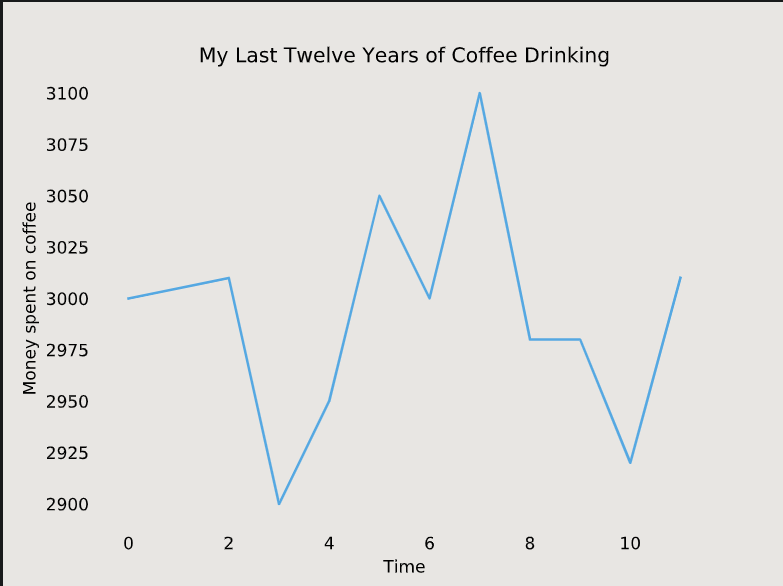
- We can also change the position of our title accordingly, and for that, we use loc parameter in title(). It has options like: 'right', 'left', and 'center' in which 'center' is by default.
plt.title('My Last Twelve Years of Coffee Drinking',loc='right')
plt.show()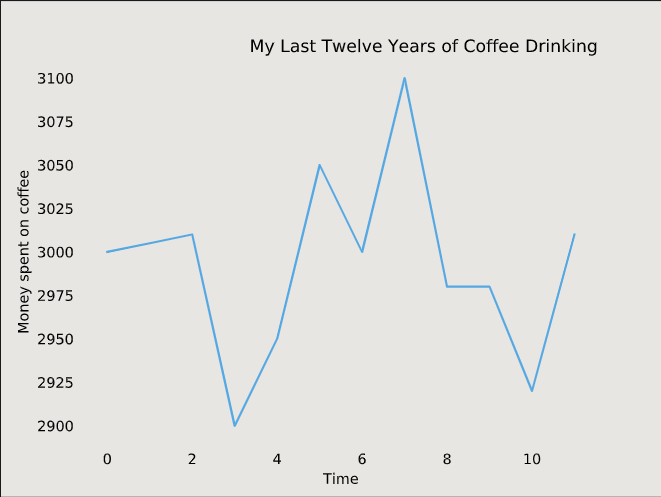
Axis
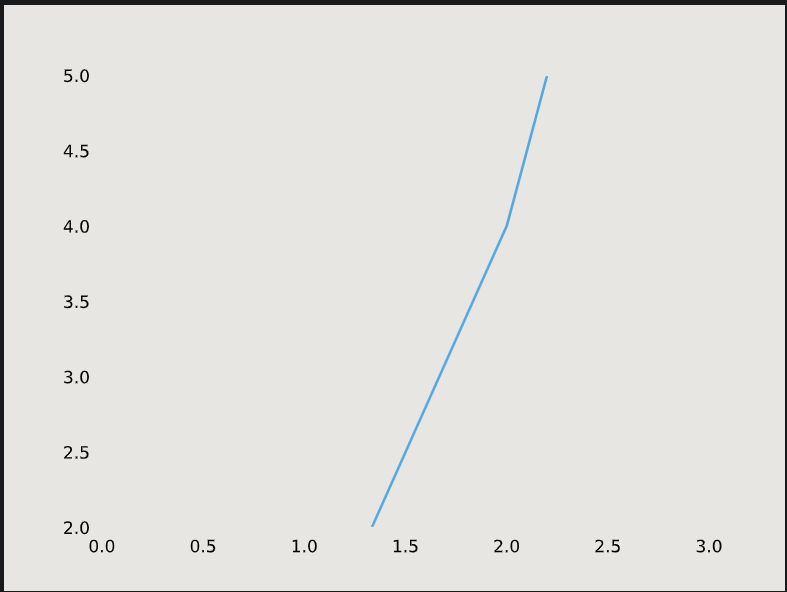
- Zooming in or out on the plot can be useful occasionally, especially if there is a specific detail we want to focus.
- We can use plt.axis to zoom (). plt.axis() is used by passing a list as input.
- This list should contain: Minimum x-value displayed, maximum x-value displayed, minimum y-value displayed, and maximum y-value displayed.
- For Instance, if we want to display a plot from
x=0tox=5and fromy=2toy=7, we would callplt.axis([0, 5, 2, 7]).x = [0, 1, 2, 3, 4] y = [0, 1, 4, 9, 16] plt.plot(x, y) plt.axis([0, 3, 2, 5]) plt.show()