Histograms
Histograms
- A histogram is an image of data that looks like a bar graph and groups several categories into columns along the horizontal x-axis.
- It is used to show the frequency distribution graph.
- Basically, It is a number of observations within each internal given.
- The number count or percentage of occurrences in the data for each column is represented by the vertical y-axis.
- For example, if you want to display how many people have had Instagram followers between in range zero - 10, 11 - 20, 21 - 30, 31 - 40, 41 - 50, 51 -60, 61 - 70, and 71 - 80. The histogram chart would look like:
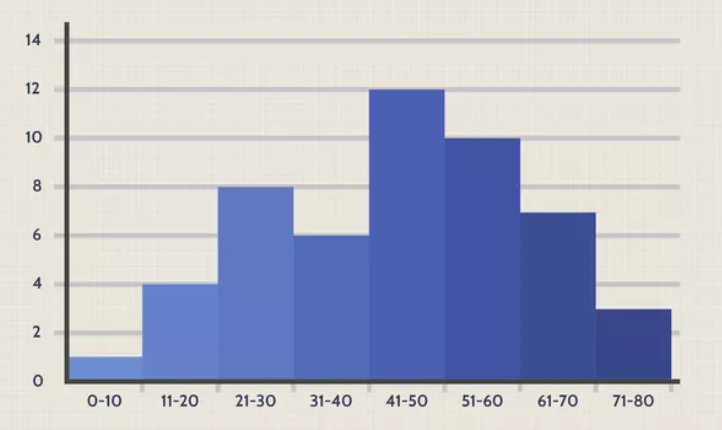 The x-axis is showing the number of followers on Instagram and the y-axis, it is showing the frequency distribution of how many people have this many followers and so on.
Create Histogram
- Now we are going to learn how to create a histogram and in order to do that all we need is an array of numbers to give.
- The function used to create a histogram is hist() it requires an array as an argument.
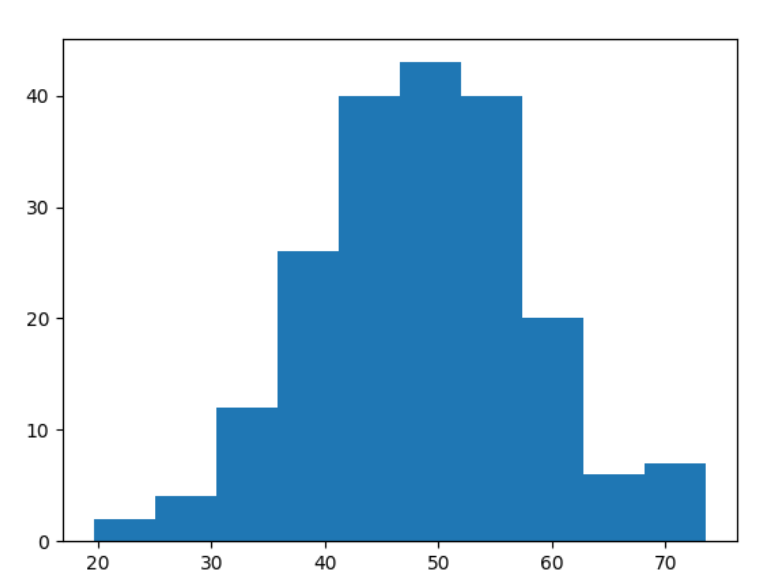
- For now, we are going to use Numpy to randomly generate 200 values, where the values will be concentrated around 50 and the standard deviation is 10:
import numpy as np
x = np.random.normal(50, 10, 200)
print(x)

#Returns
# [55.70108918 38.29919583 55.81828687 41.47128818 60.897827   32.78469312
#  53.62881874 39.58916255 45.37731274 58.20629179 58.23814827 53.68647164
#  38.51564485 59.03635735 54.11523743 48.79951843 46.82958699 56.95786573
#  62.35800349 33.27207057 44.80259736 41.88762426 58.68454873 43.06677663
#  49.6628192  67.06269837 68.41227224 36.68354106 42.81415778 34.36625087
#  57.3361391  55.43163922 49.94911588 35.55501738 35.17646889 37.35777046
#  56.07707905 48.28443342 54.23152588 58.29264145 36.15508456 54.14652093
#  52.37288214 53.21854696 33.9617479  61.66036151 53.26786232 37.37739758
#  33.07333517 39.25132908 66.1726773  57.49632168 59.54034863 57.1268224
#  56.0176531  47.7071597  52.72617274 59.39139163 48.94529751 71.95961033
#  46.28913826 41.42347242 25.73600773 43.164083   56.3780118  37.10101523
#  49.08640553 43.7173265  57.36487904 64.70411505 44.96693606 41.91904105
#  48.12295727 51.24781437 41.01660274 69.4067659  44.22124921 38.54511321
#  46.50898964 58.13115509 65.47483559 50.25368443 53.94623906 60.5943126
#  50.07316205 54.47404859 66.6593775  37.59614744 33.96230183 51.60097947
#  60.40548912 50.21617523 58.95467234 39.34313254 49.22473296 39.31644774
#  52.89704324 51.49240103 58.87986894 49.33672186 58.79573008 57.19163298
#  50.48296585 67.41756125 41.31952542 52.9988233  32.83836562 42.85631157
#  40.75450087 58.3589145  38.11401643 62.02001568 57.43111304 61.06106607
#  66.32568958 60.08645214 48.20773168 55.03079482 39.39972188 54.73913797
#  71.72517407 59.98265339 52.47625978 47.65336182 65.31409713 43.47304708
#  47.902406   54.24208893 53.82285622 46.69373633 36.06644265 58.80938179
#  47.25804507 29.12749142 40.67472043 35.42303436 43.88374844 68.49168046
#  58.97210548 60.03444705 43.56477533 48.38344693 41.30198934 33.08193837
#  54.24425614 60.71973626 65.60017265 45.84980495 35.45242293 39.20129152
#  58.26372873 54.45572336 36.19843967 51.28981817 59.61251437 53.47677321
#  53.56069119 59.38448471 48.12585851 49.26715578 55.06868477 47.94064541
#  35.80465915 47.83494994 65.27458966 55.21722302 56.0207855  45.96270343
#  39.45715906 39.82795206 57.34537025 63.06229431 60.1370541  54.43050894
#  36.7770104  61.73538056 51.79222192 59.04657697 56.2872907  58.22101358
#  61.20467294 35.04527821 44.5545085  53.24002408 38.40238678 48.16403873
#  47.12492569 57.61374096 72.30687828 65.52107736 60.90721994 52.85035572
#  62.8292058  34.02267077 42.82088918 48.52233393 39.86881213 63.49997637
#  40.14507431 64.66296535]
And Now we will use hist() to create a histogram:
import matplotlib.pyplot as plt
import numpy as np
x = np.random.normal(50, 10, 200)

plt.hist(x)
plt.show()
Output: