Pyplot
Matplotlib Pyplot
- pyplot is the submodule of matplotlib and comes with most of the functions and features for data visualization.
- It is imported using the alias plt using this command:
import matplotlib.pyplot as pltLet's draw a simple line graph using this setup:
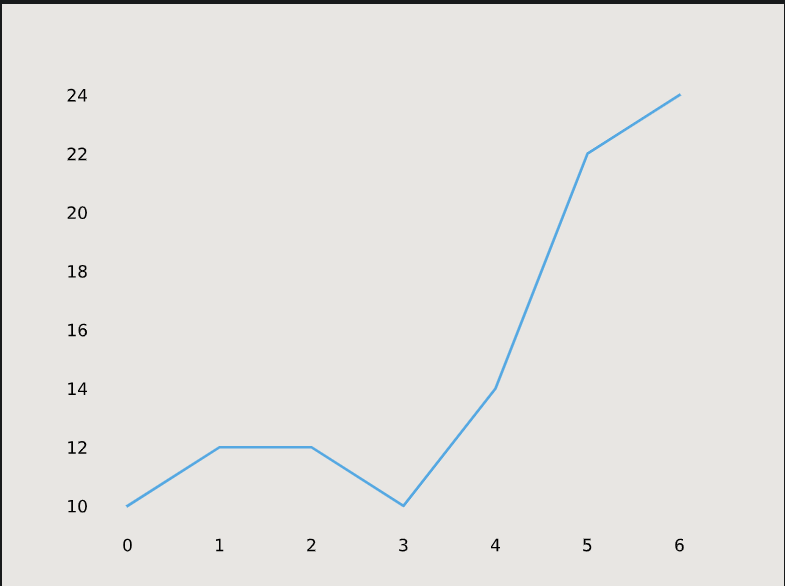
from matplotlib import pyplot as plt x-coordiante = [0,1,2,3,4,5,6] y-coordinate = [10,12,12,10,14,22,24] plt.plot(x-coordinate, y-coordinate) plt.show() x-coordianteis a variable holding a list of x-values for each point on our line graph.y-coordinateis a variable holding a list of y-values for each point on our line graph.pltis the name we have given to the Matplotlib module we have imported at the top of the code.plt.plot(x-ccordinate, y-coordinate)will create the line graph.plt.show()will actually display the graph.