Line Styles
Linestyles
- While plotting we can specify different colors of the line using the keyword color with 'HTML color name' or 'HEX Code'.
from matplotlib import pyplot as plt

x = [0, 1, 2, 3, 4]
y1 = [200, 400, 650, 800, 850]
y2 = [150, 500, 550, 550, 560]

plt.plot(x, y1, color='green')
plt.plot(x, y2, color='#AAAAAA')
plt.show()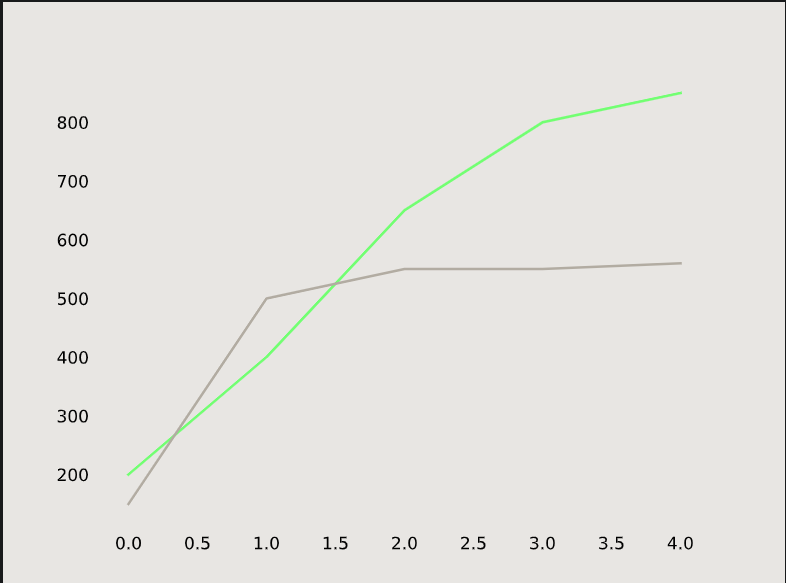
-
We can also make a line dotted or dashed using the keyword
linestyle.plt.plot(x, y1, linestyle='--', color='green') plt.plot(x, y2, linestyle=':', color='#AAAAAA') plt.show()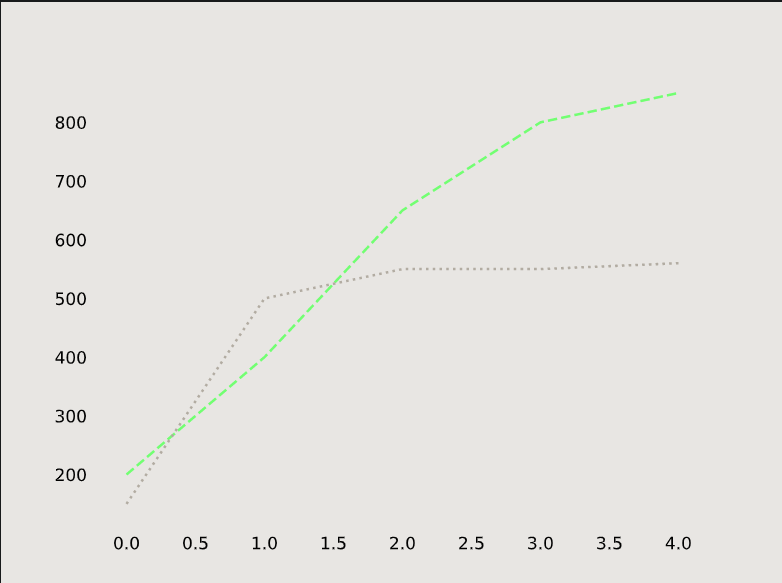
-
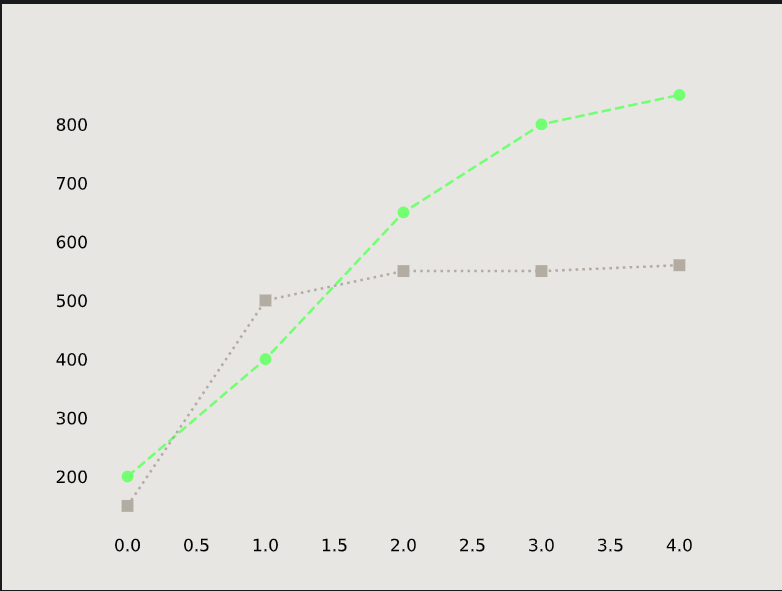
We can also add a marker using the keyword marker:
plt.plot(x, y1, linestyle='--', marker='o', color='green')
plt.plot(x, y2, linestyle=':', marker='s', color='#AAAAAA')
plt.show()