Electric Vehicle Sales Dashboard in Power BI
Objective:
Learn how to import, prepare, visualize, and analyze real-world Electric Vehicle sales data from India using Power BI, and create an interactive dashboard to extract actionable insights.
Step 1: Understand the Dataset
-
Source: Clean Mobility Shift Website
-
Download: Kaggle Dataset - Electric Vehicle Sales by State in India (CSV format)
-
Size: ~96,846 rows, 8 columns
-
Key Fields:
-
Year, Month Name, Date
-
State (Indian states/UTs)
-
Vehicle Class (motor car, cab, etc.)
-
Vehicle Category (4-Wheelers, Others)
-
Vehicle Type (Personal, Shared)
-
EV Sales Quantity (number of vehicles sold)
-
Note: Dataset is clean and ready for use.
Step 2: Load Data into Power BI
-
Open Power BI Desktop
-
Click Get Data > Text/CSV
-
Select and load the downloaded CSV file
Step 3: Data Preparation
-
Open Power Query Editor to inspect data
-
Check for missing values or errors (minimal cleaning needed here)
-
Since there is only one table, no relationships need to be created
Step 4: Create Key Measures
Create the following DAX measures for analysis:
-
Total EV Sales =
SUM([EV Sales Quantity]) -
Monthly Sales = Aggregate EV Sales by Month
-
State-wise Sales = Aggregate EV Sales by State
-
Sales by Vehicle Class = Aggregate by Vehicle Class
-
Yearly Sales by Vehicle Category = Aggregate by Year and Category
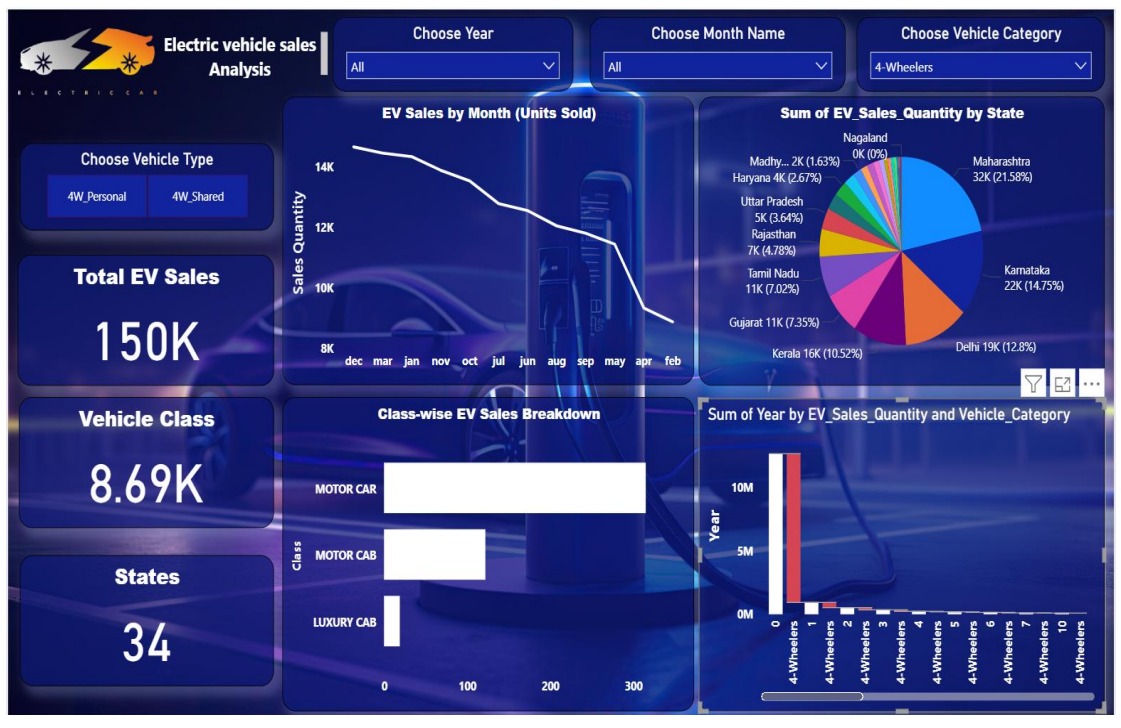
Step 5: Build Visualizations
-
Card Visual: Show Total EV Sales dynamically
-
Line Chart: Monthly sales trend (shows peaks and dips)
-
Pie Chart: State-wise sales distribution (percentage share)
-
Bar Chart: Sales by Vehicle Class
-
Waterfall Chart: Yearly sales by Vehicle Category
Step 6: Add Filters and Slicers
-
Add Dropdown Slicers for:
-
Year
-
Month
-
Vehicle Category
-
-
Add Toggle Buttons to switch between Personal and Shared vehicle types
Step 7: Make Dashboard Interactive
-
Connect all slicers to every visual
-
Selecting any filter updates all charts dynamically for seamless data exploration
Step 8: Design and Format
-
Use consistent color themes and fonts
-
Add titles, labels, and legends for clarity
-
Arrange visuals in a logical flow for easy understanding
Step 9: Insights from the Dashboard
-
Top EV-selling States: Maharashtra, Karnataka, Delhi
-
Monthly Sales Pattern: Peak in December, dip in January-February
-
Popular Vehicle Class: Motor cars lead sales
-
Market Focus: Majority sales are 4-Wheelers
Step 10: Recommended Actions Based on Insights
-
Boost EV sales in states with low sales figures
-
Investigate causes for monthly sales dip and address strategically
-
Promote shared vehicles and smaller 2/3-wheelers for market expansion
-
Regularly update dataset to maintain dashboard accuracy
-
Use high-performing states as benchmarks for improvement
Conclusion
By completing this lesson, you will be able to:
-
Import and prepare data in Power BI
-
Create meaningful and interactive visualizations
-
Use filters and slicers to explore data dynamically
-
Draw actionable insights from EV sales data
-
Make data-driven decisions to improve EV market strategies